
ER Diagram Guide: How to Design Entity-Relationship Diagrams Step by Step (2026)
A practical walkthrough for building ER diagrams from scratch. Covers Chen and Crow's Foot notation, cardinality rules, normalization, real-world research examples, and the best free tools available.
Entity relationship diagrams sit at the heart of sound data management for research. Whether you are building a survey database for a social science study, tracking outcomes in a clinical trial, or structuring a large multi-table dataset for your dissertation, an ER diagram gives you a shared visual language that prevents costly mistakes before a single row of data is collected.
This guide takes you through everything you need: foundational concepts, notation systems, a hands-on creation process, real research examples, tool recommendations, and a concise set of best practices to keep your diagrams clean and useful.

Text to Diagram Generator
Create professional ER diagrams from plain-text descriptions instantly. Supports Chen and Crow's Foot notation for research projects.
Try it free →What Is an ER Diagram?
An entity relationship diagram (ERD) is a schematic that maps the data objects within a system and the ways those objects relate to one another. Peter Chen introduced the concept in 1976, and it quickly became the accepted standard for relational database modeling.
In a research context, the ER diagram acts as the architectural blueprint for your study's data layer. It captures three core ideas:
- Entities: The distinct subjects or concepts your study tracks (e.g., Participants, Trials, Instruments)
- Attributes: The individual fields that describe each entity (e.g., participant_id, age, treatment_group)
- Relationships: The logical connections between entities (e.g., a Participant is assigned to a Protocol)

ER diagrams share structural DNA with data pipeline diagrams: both map how discrete components pass information between one another across a system
Why Researchers Benefit from ER Diagrams
| Benefit | Description |
|---|---|
| Data organization | Surfaces what data must be collected before fieldwork begins |
| Integrity | Enforces referential integrity across related tables |
| Communication | Gives collaborators and advisors a common mental model |
| Scalability | Makes extending the database as the study grows far less painful |
| Reproducibility | Provides a precise record of data structure for replication studies |
If you are completing a thesis or dissertation, the ER diagram typically appears in the methodology chapter alongside your conceptual framework and research design rationale.
Core Components of an ER Diagram
Three building blocks underpin every ER diagram, regardless of the notation style you choose.
1. Entities
An entity is any real-world object or concept for which you need to store data. Typical research entities include:
- Participant or Subject
- Experiment or Trial
- Measurement or Observation
- Instrument or Survey
- Publication or Dataset
Entities appear as rectangles in most ER diagrams. In a relational database, each entity maps directly to a table.
2. Attributes
Attributes capture the properties of an entity. Chen notation draws them as ovals branching off the parent entity rectangle, while Crow's Foot notation lists them inside the rectangle itself.
Attribute types at a glance:
| Type | Symbol | Example |
|---|---|---|
| Simple | Single oval | participant_name |
| Composite | Oval with child ovals | full_name (first, last) |
| Derived | Dashed oval | age (calculated from date_of_birth) |
| Multi-valued | Double oval | phone_numbers |
| Key | Underlined label | participant_id (primary key) |
3. Relationships
Relationships define how entities interact. In Chen notation they appear as diamonds between entity rectangles; in Crow's Foot notation they appear as lines with endpoint symbols indicating cardinality.
Cardinality options:
| Cardinality | Meaning | Example |
|---|---|---|
| One-to-One (1:1) | Each instance on either side relates to exactly one instance on the other | One participant holds one signed consent form |
| One-to-Many (1:N) | One instance on one side relates to multiple instances on the other | One principal investigator oversees many experiments |
| Many-to-Many (M:N) | Multiple instances on each side can relate to multiple instances on the other | Many participants complete many surveys |
ER Diagram Notation Types
Three notation systems cover nearly all ER diagramming in academic and professional settings. Knowing each one lets you pick the right format and read diagrams produced by others.
Chen Notation
The original system Peter Chen published in 1976. Its symbol set includes:
- Rectangles for entities
- Ovals for attributes
- Diamonds for relationship names
- Plain lines connecting all components
┌──────────────┐         ◇──────────◇         ┌──────────────┐
│  Participant  │────────│  Enrolls   │────────│    Study      │
└──────────────┘         ◇──────────◇         └──────────────┘
       │                                              │
    (name)                                        (title)
    (age)                                        (start_date)
    (id)*                                        (study_id)*
Best for: Academic settings, conceptual modeling, and courses where students are learning database theory for the first time.
Crow's Foot Notation (IE Notation)
The dominant notation in professional database design. It compresses attribute lists inside entity boxes and encodes cardinality through endpoint symbols: a circle represents zero, a single dash represents one, and a forked "crow's foot" shape represents many.
┌─────────────────┐          ┌─────────────────┐
│   Participant    │          │      Study       │
├─────────────────┤          ├─────────────────┤
│ participant_id   │──────<  │ study_id          │
│ name             │          │ title             │
│ age              │          │ start_date        │
│ email            │          │ principal_inv     │
└─────────────────┘          └─────────────────┘
Best for: Practical database implementation, SQL schema design, and any project where the diagram feeds directly into database creation.
UML Class Diagram Notation
Unified Modeling Language notation extends relational concepts to entire software systems. It uses:
- Rectangles split into sections for name, attributes, and methods
- Lines annotated with multiplicity values (1, 0.., 1..)
- Distinct symbols for association, aggregation, and composition
Best for: Research software systems that mix data storage with behavioral logic, and interdisciplinary teams already familiar with UML conventions.
Choosing Your Notation
| Scenario | Recommended Notation |
|---|---|
| Thesis or dissertation methodology chapter | Chen (most legible in academic literature) |
| Building a research database in SQL | Crow's Foot (maps directly to table definitions) |
| Interdisciplinary software-driven project | UML (broader expressive range) |
| Quick conceptual sketch on paper | Chen (fewest symbols to remember) |
How to Draw an ER Diagram: Step-by-Step Guide
The logical sequence for building an ER diagram is the same whether you are sketching on paper or working in a diagramming tool. Follow these steps to move from a blank page to a finished, accurate diagram.
Step 1: Define Your Research Data Requirements
Before drawing anything, write down what your study must track. Work through these prompts:
- Which subjects or participants form the core of your study?
- What observations or measurements will you record for each subject?
- Which instruments or tools produce or collect the data?
- What contextual variables (time, location, group assignment) affect interpretation?
- Which of these elements interact with one another?
Example: A clinical psychology study might need to track participants, therapy sessions, assessment scores, therapists, and treatment protocols.
Step 2: Identify Entities
Scan your requirements list for the main nouns. Each major noun that has its own set of properties and can exist independently becomes a candidate entity.
Rules of thumb:
- Every entity needs a unique identifier (a primary key)
- If two candidate entities always share the same attributes, they may actually be one entity
- Ask whether a concept is a standalone object or simply a property of something else
Step 3: Define Attributes for Each Entity
For every entity, enumerate its fields and answer these questions:
- Which field is the primary key?
- Are any fields derived from other fields?
- Are any fields multi-valued (able to hold more than one value)?
- Which fields are mandatory, and which are optional?

Like software architecture diagrams, ER diagrams demand careful identification of each component and an explicit map of how they interconnect
Step 4: Establish Relationships
For each pair of related entities, work through four questions:
- Does a relationship actually exist? Not every entity pair needs a direct connection.
- What is the cardinality? One-to-one, one-to-many, or many-to-many?
- Is participation total or partial? Must every instance be part of the relationship, or only some?
- What verb names the relationship? (e.g., "is enrolled in", "measures", "reports to")
Step 5: Handle Many-to-Many Relationships
Many-to-many relationships cannot map directly into relational database tables. You must introduce a junction table (also called an associative entity or bridge table) to resolve them.
Example:
Participant <<>> Survey    (Many-to-Many)

Resolved as:

Participant ──> ParticipantSurvey <── Survey
                 | participant_id
                 | survey_id
                 | completion_date
                 | score
The junction table ParticipantSurvey stores foreign keys from both parent entities plus any attributes that belong specifically to the act of a participant completing a survey.
Step 6: Normalize Your Design
Apply normalization to reduce redundancy and prevent data anomalies:
- 1NF: Every cell holds a single atomic value; no repeating groups within a row
- 2NF: Every non-key attribute depends on the whole primary key, not just part of it
- 3NF: No non-key attribute depends on another non-key attribute
Step 7: Draw, Review, and Refine
Select your notation and produce the visual diagram. Then:
- Walk through the diagram with your advisor or a data manager
- Map real sample data to the diagram to test whether it fits
- Revise any entities, attributes, or relationships that the review exposes as incorrect
ER Diagram Examples for Research
Example 1: Survey Research Database
A social science study collecting survey responses across multiple field sites:
┌─────────────────┐     ┌─────────────────┐     ┌─────────────────┐
│   Participant    │     │    Response      │     │     Survey      │
├─────────────────┤     ├─────────────────┤     ├─────────────────┤
│ participant_id PK│──┐  │ response_id PK  │  ┌──│ survey_id PK    │
│ name             │  └─>│ participant_id FK│  │  │ title           │
│ age              │     │ survey_id FK    │<─┘  │ version         │
│ gender           │     │ question_id FK  │     │ created_date    │
│ site_id FK       │     │ answer_value    │     └─────────────────┘
└─────────────────┘     │ submitted_at    │
                        └─────────────────┘
         │                                        ┌─────────────────┐
         └───────────────────────────────────────>│      Site       │
                                                  ├─────────────────┤
                                                  │ site_id PK      │
                                                  │ location        │
                                                  │ coordinator     │
                                                  └─────────────────┘
Example 2: Clinical Trial Database
A medical research study tracking patients, treatment assignments, and recorded outcomes:
┌─────────────────┐     ┌─────────────────┐     ┌─────────────────┐
│    Patient       │     │   Treatment     │     │    Outcome      │
├─────────────────┤     ├─────────────────┤     ├─────────────────┤
│ patient_id PK   │──┐  │ treatment_id PK │──┐  │ outcome_id PK   │
│ demographics     │  └─>│ patient_id FK   │  └─>│ treatment_id FK │
│ diagnosis        │     │ drug_id FK      │     │ measure_type    │
│ enrollment_date  │     │ dosage          │     │ value           │
│ consent_status   │     │ start_date      │     │ recorded_date   │
└─────────────────┘     │ end_date        │     └─────────────────┘
                        └─────────────────┘
Example 3: Ecological Research Database
A biodiversity study recording species sightings across distributed field sites:
┌─────────────────┐     ┌─────────────────┐     ┌─────────────────┐
│    Species       │     │  Observation    │     │   Field Site    │
├─────────────────┤     ├─────────────────┤     ├─────────────────┤
│ species_id PK   │──┐  │ observation_id PK│ ┌──│ site_id PK      │
│ scientific_name  │  └─>│ species_id FK   │ │  │ gps_coordinates │
│ common_name      │     │ site_id FK      │<┘  │ habitat_type    │
│ taxonomy_class   │     │ count           │     │ elevation       │
│ conservation_st  │     │ date_observed   │     │ region          │
└─────────────────┘     │ observer_id FK  │     └─────────────────┘
                        └─────────────────┘
For additional guidance on presenting research data visually, see our research data visualization best practices guide.
Best ER Diagram Tools for Researchers
The right tool depends on your technical comfort level, your budget, and whether you are working alone or with a team.
Free ER Diagram Tools
| Tool | Type | Best For | Key Feature |
|---|---|---|---|
| draw.io (diagrams.net) | Visual drag-and-drop | General diagramming | Completely free with no account required |
| ERDPlus | Web-based | Students and academics | Purpose-built specifically for ERDs |
| dbdiagram.io | Code-based | Developers | Write markup, get rendered diagrams |
| Mermaid | Code-based | Documentation | Embeds cleanly inside Markdown files |
| ChartDB | Open-source | Technical users | Generates SQL directly from diagrams |
Paid ER Diagram Tools
| Tool | Starting Price | Best For | Key Feature |
|---|---|---|---|
| Lucidchart | $7.95/mo | Teams and collaboration | Real-time co-editing |
| MySQL Workbench | Free (open-source) | MySQL databases | Forward and reverse engineering |
| Microsoft Visio | $5/mo | Enterprise environments | Deep Microsoft ecosystem integration |
AI-Powered Diagram Generation
For researchers who need diagrams quickly without spending time on manual layout, AI-powered generation offers a compelling shortcut.
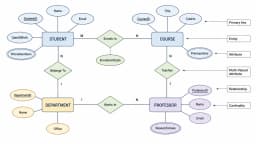
ER Diagram Generator
Describe your entities and relationships in plain language and get a clean, labeled ER diagram in seconds — export-ready for your paper or thesis.
Generate an ER diagram →With an ER diagram generator, you describe your data model in plain sentences and receive a structured diagram within seconds. This is especially valuable during early research planning, when your schema is still shifting. Write something like "Patient has patient_id, name, and diagnosis" and "Patient receives Treatment," and the tool produces a clean, exportable ER diagram with minimal effort.
ER Diagrams in the Research Workflow
During Research Design
Build your initial ER diagram at the same time as your conceptual framework. The two artifacts are complementary rather than redundant:
- Your conceptual framework maps theoretical relationships between research constructs
- Your ER diagram maps the practical data tables needed to measure and test those constructs
During Data Collection
A finalized ER diagram steers your data collection instruments toward the right fields in the right format. Without one, studies frequently encounter:
- Missing fields that become critical only during analysis
- Duplicate data entry scattered across multiple collection forms
- Formatting inconsistencies that break joins between related tables
During Analysis
When the time comes to join tables, apply filters, or aggregate across subgroups, your ER diagram serves as a navigation map. It tells you at a glance which tables to join, on which keys, and where to locate each variable.
During Writing
Place a streamlined version of your ER diagram in the methodology chapter. Reviewers and committee members take it as evidence that data collection was systematic rather than ad hoc. For broader manuscript structure guidance, see our research manuscript writing guide.

Rigorous statistical analysis depends on a well-structured underlying database. ER diagrams ensure your data architecture is ready to support the analyses your research questions require.
Best Practices for Research ER Diagrams
1. Start Conceptual, Then Add Detail
Sketch a high-level diagram first, showing only entities and their relationship labels. Layer in attributes and constraints during subsequent passes rather than trying to capture everything at once.
2. Adopt Consistent Naming Conventions
| Convention | Example | Use When |
|---|---|---|
| snake_case | participant_id | SQL column and table names |
| camelCase | participantId | Programming-language interfaces |
| PascalCase | ParticipantId | Entity and class names |
Pick one style and apply it uniformly across the entire diagram.
3. Maintain a Data Dictionary
A diagram alone cannot explain intent. Keep a companion data dictionary that records:
- The reason each entity exists in the model
- The precise meaning of each attribute
- Why a relationship carries its particular cardinality
- Any constraints, validation rules, or business logic that apply
4. Design for Data Growth
Research projects routinely collect more data than originally scoped. Build flexibility in from the start:
- Prefer surrogate keys (auto-incremented IDs) over natural keys that may change
- Add timestamp fields for created_at and updated_at on every table
- Consider versioning strategies for entities whose values change over time
5. Validate Against Real Data
Before treating the diagram as final, load a small sample of actual data into the schema. Real data exposes:
- Attributes that were omitted from the original design
- Relationships whose cardinality was assumed incorrectly
- Normalization gaps that produce redundant rows
6. Keep the Visual Layout Clean
A diagram that is hard to read offers little practical value. Follow these layout principles:
- Cap each diagram at roughly 10 to 15 entities; break larger models into logically grouped sub-diagrams
- Apply color coding to cluster related entities (for example, blue for participant data, green for measurement data)
- Maintain uniform spacing and alignment throughout
- Include a legend defining any notation symbols or color categories you use
For color selection guidance, refer to our scientific color palette guide.
Common Mistakes in Research ER Diagrams
Mistake 1: Treating Attributes as Entities
Wrong: Creating a separate "Address" entity when address information is just a set of fields that belong to "Participant."
Right: Promote a concept to its own entity only when it has multiple attributes of its own and participates in relationships independent of its parent.
Mistake 2: Skipping Normalization
Recording a therapist's full name inside every session row leads to update anomalies: change the name in one place and you must update dozens of rows.
Fix: Move the therapist's details into a dedicated Therapist entity and reference it from Session via a foreign key.
Mistake 3: Leaving Many-to-Many Relationships Unresolved
A direct many-to-many line between two entities cannot be implemented as-is in a relational database.
Fix: Always decompose M:N relationships into two 1:N relationships using a junction table.
Mistake 4: Over-Engineering the Model
Creating 50 entities with exhaustive attribute lists for a study that only requires five core tables slows development and confuses collaborators.
Fix: Model only what your research questions require. The schema can grow incrementally as the project expands.
Mistake 5: Omitting Primary Keys
Without a primary key, rows in a table have no reliable unique identifier, which breaks every join and every integrity constraint.
Fix: Add a dedicated ID field to every entity (e.g., participant_id) even when a natural identifier already exists.
Frequently Asked Questions
What is an ER diagram and why is it important for research?
An ER diagram (entity relationship diagram) is a visual model that maps the data objects in a system and the connections between them. For research, it acts as a blueprint for the study database, enforcing referential integrity, preventing redundant data storage, and giving collaborators and reviewers a clear picture of how the data is organized.
What is the difference between Chen notation and Crow's Foot notation?
Chen notation uses separate geometric shapes for each element: rectangles for entities, ovals for attributes, and diamonds for relationship names. It is the format most commonly taught in academic database courses. Crow's Foot notation is more compact: attributes are listed inside entity rectangles, and cardinality is encoded through endpoint symbols on the connecting lines. Crow's Foot is the preferred choice for practical database implementation work.
Can I use an ER diagram for qualitative research?
Yes. Although ER diagrams are most associated with quantitative database design, qualitative researchers can use them to structure coding schemes, organize transcripts and observation records, or map the architecture of qualitative analysis software projects in tools like NVivo or ATLAS.ti.
How many entities should my ER diagram have?
Most research projects fall somewhere between 5 and 15 entities. A focused survey study may need only 3 to 5 (Participant, Survey, Response), while a multi-site clinical trial could require 10 to 15 (Patient, Treatment, Drug, Outcome, Adverse Event, Site, Investigator, and others). When an entity count climbs past 15, splitting the model into logically grouped sub-diagrams usually improves readability.
What is the best free ER diagram tool for students?
ERDPlus is purpose-built for academic database modeling and is entirely free, making it a natural starting point for students. For more general diagramming flexibility, draw.io (diagrams.net) requires no account and supports a wide range of ER shapes. If you prefer writing markup over placing shapes manually, dbdiagram.io generates clean ER diagrams from a simple text syntax.
How do I convert an ER diagram to a real database?
Each entity becomes a table, each attribute becomes a column, and relationships become foreign key constraints. For one-to-many relationships, the foreign key goes on the many side. Many-to-many relationships require a junction table that holds foreign keys from both parent entities. Tools such as MySQL Workbench and dbdiagram.io can generate SQL code automatically from your diagram.
What is a junction table and when do I need one?
A junction table (also called an associative entity or bridge table) resolves many-to-many relationships by introducing a new table that stores the foreign keys from both related entities. For example, if Participants can complete multiple Surveys and each Survey can be completed by multiple Participants, you need a ParticipantSurvey table containing participant_id and survey_id as its core columns.
Should I include my ER diagram in my thesis or dissertation?
Yes. Placing an ER diagram in your methodology chapter signals to reviewers and committee members that your data collection was structured and deliberate. Include a simplified version showing the key entities and their relationships in the main text. If the full diagram is large, move it to an appendix. This practice is especially valuable for studies that rely on custom databases or complex multi-table data structures.
Conclusion
A well-built ER diagram is far more than a technical deliverable. It is a planning instrument that imposes discipline on your data architecture before data collection begins, and a communication artifact that helps every stakeholder understand how the pieces fit together.
Key principles to take away:
- Match notation to context: Chen notation for academic audiences, Crow's Foot for SQL implementation
- Let your research questions drive the model: every entity and relationship should serve a specific analytical purpose
- Normalize deliberately: eliminating redundancy at the design stage prevents data quality problems later
- Choose the right tool: free tools like ERDPlus and draw.io work well for most research projects; AI-powered generators speed up early-stage prototyping
- Document your decisions: a data dictionary alongside the diagram makes your research reproducible and defensible
- Treat the diagram as a living document: revisit and refine it as your understanding of the data evolves
Regardless of whether your study involves a three-table survey dataset or a sprawling multi-site longitudinal database, the investment in a proper ER diagram pays returns throughout every phase of the research lifecycle.
Additional Resources
- How to Create a Conceptual Framework for Research
- Research Data Visualization Best Practices
- How to Write a Research Manuscript in IMRAD Format
- Scientific Color Palette for Research Papers
- How to Make Scientific Diagrams for Research Papers
Ready to build your ER diagram? Try Figviz's Text to Diagram Generator to turn plain-language descriptions into professional diagrams in seconds.
Author

Categories
More Posts

Top 8 Electrical Wiring Diagram Tools for 2026 (Honest Review)
An in-depth look at 8 wiring diagram software options for electrical, automotive, and industrial projects. Features, pricing, and real limitations compared side by side.

8 Best Free EdrawMax Alternatives in 2026 (No Watermark)
Top free EdrawMax alternatives without watermarks: draw.io, Lucidchart, Canva and more. Cloud-based diagramming tools for flowcharts and mind maps.

How to Make a Number Line (Free, Printable)
Learn how to make a number line for integers, fractions, decimals, and negative numbers. Print one in seconds with Figviz or draw it by hand using our step-by-step guide.